• Skip to main content
  • Skip to primary sidebar

THE MAP NERD

  • Home
  • About
    • About Eric
    • Eric’s Resume
  • What We Do
    • The Real Estate Industry
    • Insights for Home Buyers and Sellers
    • Small and Medium Sized Enterprises
    • Custom Maps & Imagery
    • Personalized Maps & Gifts
  • What is GIS?
    • GIS at a Glance
    • GIS in the Wild
    • Why You Need GIS
  • Blog
  • Contact

716-946-6368

eric@themapnerd.com

custom maps

The Magic of ATM Geography

Geography

Map Nerd-ing in Real Time

Here’s a fun example of the joy of nerding out on maps [a.k.a., Map Nerd-ing] in real time:

Welcome to Fabulous Las Vegas Nevada Signage
Viva Las Vegas, indeed.

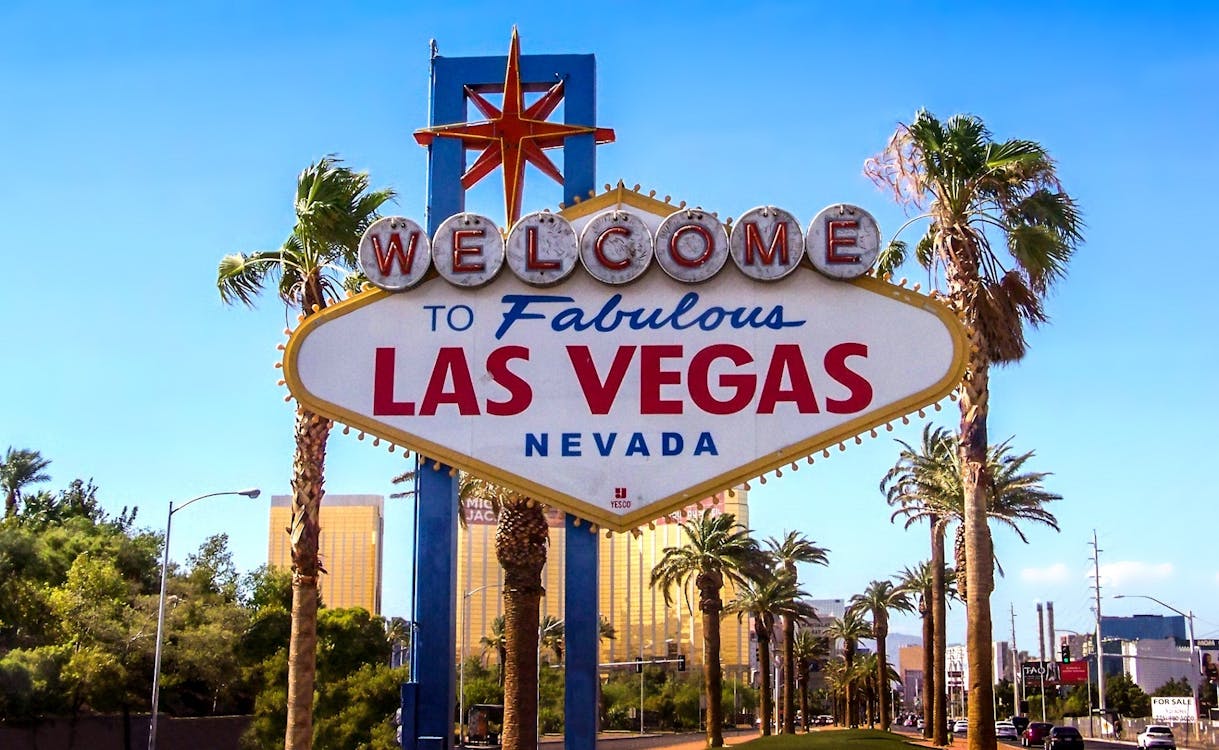
My wife and I were recently in Las Vegas — she was attending several conferences, and I was living that glorious, gorgeous, grand digital nomad life to its fullest. One day, I was looking for an ATM close to our hotel… and as everyone probably knows, using the ATM in the casino is a massive rip off: typically, service fees are somewhere around $6, second only to Gentlemen’s Clubs for most expensive ATM fees [I don’t know that firsthand, I swear. I must’ve read about it in People].

So I, like most would, pulled up Google maps and simply searched for ATMs near my location. I found a plethora of third party ATMs — you know, the kind you find in truck stops all over the country, typically with fees around $4. The Vegas Strip being a huge tourist area [basically a seeder Disney World], the fees were $4.99. And frankly, I was not about to pay $5 just for the privilege of accessing my own money. No one should have to do that [let alone a Map Nerd like myself].

That’s when I spotted one, lone Bank of America ATM in a sea of third party options. 

Close-up Photography Two Credit Cards
I needed that cash, cash, money!

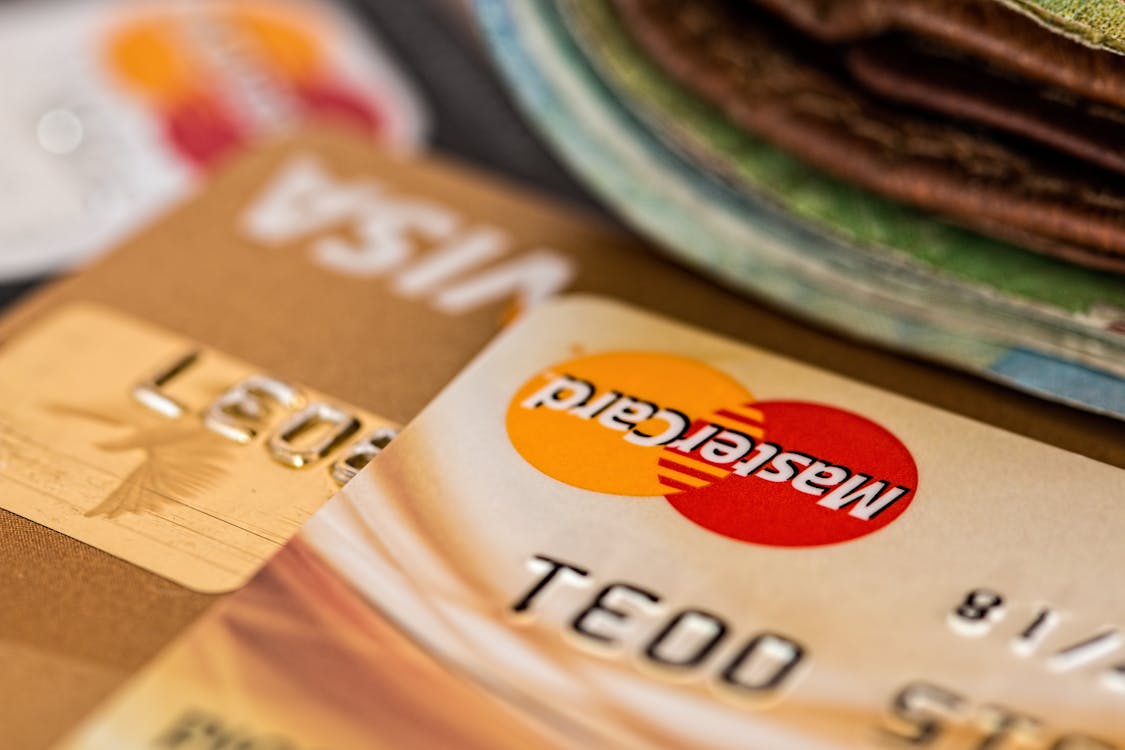
Now, I’m not a Bank of America customer, so I was still going to get hit with fees… but $3 or $3.50 is far more palatable than $5 or $6. At this point, my Map Nerd Brain kicked in: what was this lone bank-affiliated ATM doing right on the strip? I’d walked around that area for a while, and didn’t see a Bank of America branch or sign. So now, more curious than really needing to get cash, I walked over to find out what was up.

Where is this thing?

When I got to the location, it was not apparent where it was — in fact, I was standing in front of the M&Ms store! I could see several of the other third party ATMs, but no Bank of America one… even though, according to Google, I was literally on top of it. That’s when I had the realization that anyone who has ever Geocached is familiar with: “ I forgot about the Z coordinate!” 

Macro Shot of Assorted Candies
There’s really nothing better than a gigantic candy store, is there?

And with that, I headed up the first escalator… then the second… then the third… walking past M&M t-shirts, socks, stuffed plush characters, christmas ornaments, glasses, exclusive M&M flavors, and any number of other overpriced merchandise. Finally, on the fourth floor, in the far corner, by one of the bathrooms… I found it! The one, bank-affiliated ATM offering fees a full $2 lower then the ones on the ground floor [or zero fees, if you’re one of Bank of America’s 66 Million customers] — the only ATM like it within walking distance of some of the largest hotels in the country. 

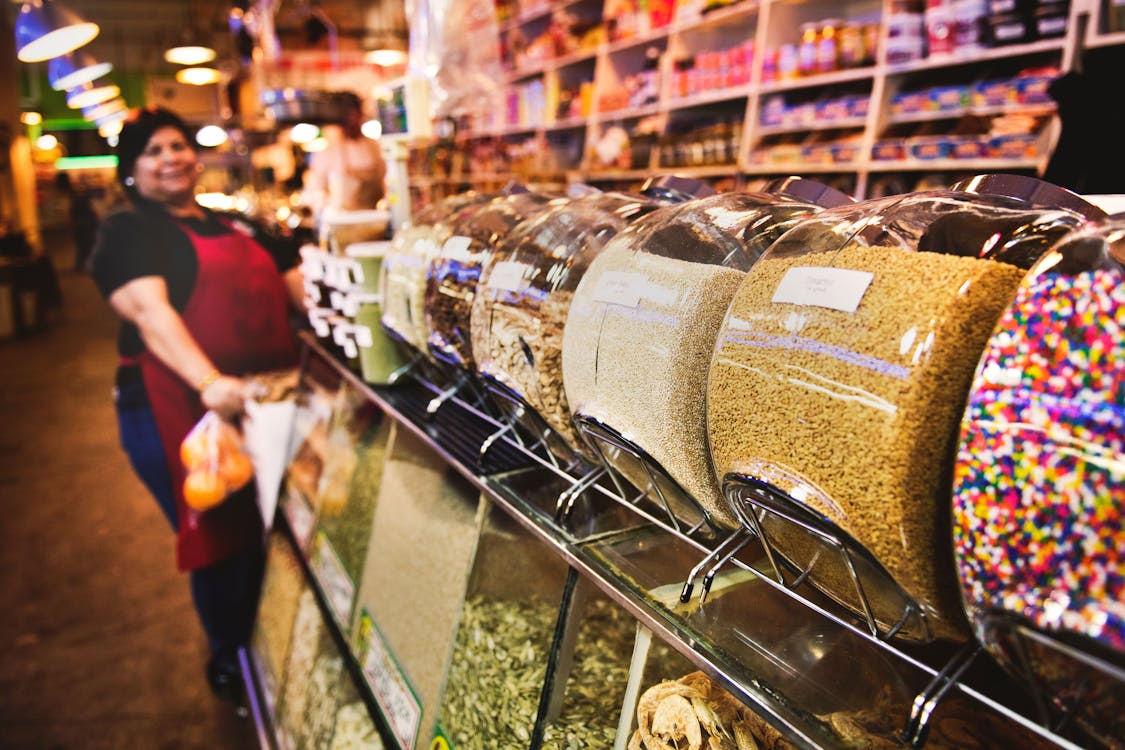
I watched as this one ATM had a continuous line of six to eight people [most of them exasperated dads in white New Balance sneakers], and realized… this is one of the most brilliant examples of two companies understanding the way modern customers interact with geography. It’s the milk and eggs being in the back of grocery store, on steroids. 

The tool tells you where to go.

Three Women Standing Beside Signage on Grass Field
Don’t forget to buy 1,000 things on your way out the door!

Just about everyone uses some kind of navigation tool now, and Bank of America identified a hole in the geographic landscape… and understood that by simply putting an ATM in the sea of high-fee, third party ATMs — and making sure it showed up on Google Maps—  they could attract a huge amount of customers, with no overhead for signage or need to open a branch.

M&Ms allowing Bank of America to place the ATM in their store gets people to walk all the way through their store just to get to it. 

I’m only occasionally a betting man, but I’d bet the house that if any of those people just looking for the ATM have kids with them, there’s a good chance they’ll make a purchase — even if it’s just $6 worth of candy [“Hey, I saved $6 on the ATM fee, let’s spend it!”], there’s the potential to attract dollars that you’d otherwise not see.

Filed Under: Geography Tagged With: custom maps, data analytics, gis, gis consultant, gis consulting, location, maps, site selection, store planning

Custom Maps for Websites, Presentations and Proposals

Custom Maps

Custom Maps for Websites, Presentations and Proposals

Let’s explore GIS [Geographic Information Systems] maps, shall we? [I say we shall. They’re a pretty integral part of what we do here at the Map Nerd].

GIS maps are an essential tool for small business websites, presentations and proposals. If you’ve got a need for any sort of environmental and land use information, or demographic information about age and income level, custom GIS maps are the tool you need. 

Types of GIS Maps

As a GIS data analytics expert [a “Map Nerd,” if you will], I can make all kinds of custom maps for your business. Things like… 

Category Maps – The most common, and perhaps simplest, GIS map divides up an area into colored sections, using a key to explain what each of the corresponding sections.

Let’s say you want to highlight your top-selling product in a particular area, your top salesperson in a particular area, your dominant competitor in an area… or, maybe, the dominant breeds of squirrels that keep trying to pry into your roof. A category map can help you pinpoint this [hey, I don’t judge what you use the map for. I’m a part of your tool kit! Your hammer wouldn’t judge you, and neither would I].

Heat Map or Quantity Map – A quantity map, heat map, or — to use the special Map Nerd term, “choropleth” map — shows patterns and demographic trends based on location. This will again use colors specified by a key, but the shade of the color will darken as the color corresponds to a range of higher numbers. 

For example, let’s say you’ve categorized those dang squirrels by breed. With a heat/quantity/choropleth map, you can see exactly where most of them live… which is perfect for figuring out your next [humane!] plan of attack. 

Or, more practically, you could use a quantity map to explore home values, median incomes, number of properties for sale, number of properties sold within a certain time frame, or average price per square footage. Choosing the right range of numbers (and number of different colors) is important to make sure the data conveys accurate information that is not misleading. 

I mean, none of those have anything to do with squirrels, but that doesn’t make them any less valid.

Cluster Map – A cluster map is similar to a heat map, since it compares frequencies of data points within an area. But instead of using color grades, it combines data points into a single number within an area for the simplest understanding. 

For example, cluster maps can tell you how many homes are for sale within one neighborhood [or how many squirrels are in one tree. Ugh, why are they so spread out!?]. 

These maps are often interactive; a user might click on the number 3 to then see additional information about the homes [squirrels] available [still too close for comfort]. 

Websites

Squirrels aside, I’d be thrilled to generate custom maps for your company and its website. A screenshot from Google Maps may not tell customers everything you want them to know — when I make a custom map of your location, I can include and exclude particular items and boundaries. 

Even better, if you’re looking to sell your business, you might also need a category map or heat map like the ones above to show your customers how effective your business is. 

And if you’re not sure which map is right for you, just ask! That’s why they call me The Map Nerd – we can discuss how best to convey your data to your customers. 

Presentations and Proposals 

You can also use a custom map for a presentation to your supervisor, team or regional/national office. Maps let you clearly share information about growth, projections, locations and more. 

After all, lists of numbers can make people fall asleep in meetings [or, you know, anywhere]. They’re hard for anyone to understand! But visual maps make it easy for people to see why you should open a new location or invest more in a particular area of your business. Don’t just say that sales have increased: show it with a map!

And if anyone has questions about the data… that’s what query tools are for! Query tools let users isolate different map layers to evaluate individual data points. 

For example, if your squi… supervisor only wants to know about sales figures for 2018 in District 1, you’d be able to click on the map to exclude other years and districts.  Pretty neat!

To get started with a custom map, fill out my contact form here or email me a themapnerd@gmail.com.

Filed Under: Custom Maps Tagged With: custom maps, data analytics, gis, gis consultant, proposals, small business, websites

Primary Sidebar

Archives

Contact The Map Nerd

  • Thanks for checking out The Map Nerd! We’d love to be the solution to your geographic problems.
    Send The Map Nerd a message below for a free consultation on how we can help you with all of your mapping, nerdy needs*.
    *While we may be able to help you with a mapping, nerdy need if you’re playing a board game like RISK or Smallworld, there are no guarantees.

  • This field is for validation purposes and should be left unchanged.

©2023 The Map Nerd // Website by Webstuff